Observer South Plugin
The foglamp-south-observer plugin is a south plugin that connects to the SKF Observer Monitor API and pulls data from Observer into FogLAMP. The plugin is able to pull a variety of different data types
The trend data produced by Observer
The diagnose result data produced by Observer
Spectral or time based waveform data
Alarm conditions raised by Observer
Notes added by the operator into Observer
The data is organised with an asset in FogLAMP for each measurement point on each machine in the Observer database. This asset contains all data other than the spectral data. The spectral data is separated into other assets and stored as a pure timeseries to allow it to be processed by the filters within FogLAMP that work on time series data and to enable sending of the data to timeseries based historians north of the FogLAMP instance.
The plugin will pull all of the data in the Observer system, starting with the oldest, historic data. Once all the data has been loaded it will then pull new data as it appears in Observer. As new machines or measurement points are added to Observer it will also pull the data for these from the Observer API.
Configuration Parameters
A Observer south service is added in the same way as any other south service in FogLAMP,
Select the South menu item
Click on the + icon in the top right
Select Observer from the plugin list
Enter a name for your Observer service
Click Next
You will be presented with the following configuration page
|
The configuration of the Observer plugin is separated into a number of tabs, each one grouping together options related to specific areas of functionality.
Connection
This tab relates to the mandatory connection configuration that is always required for the plugin.
|
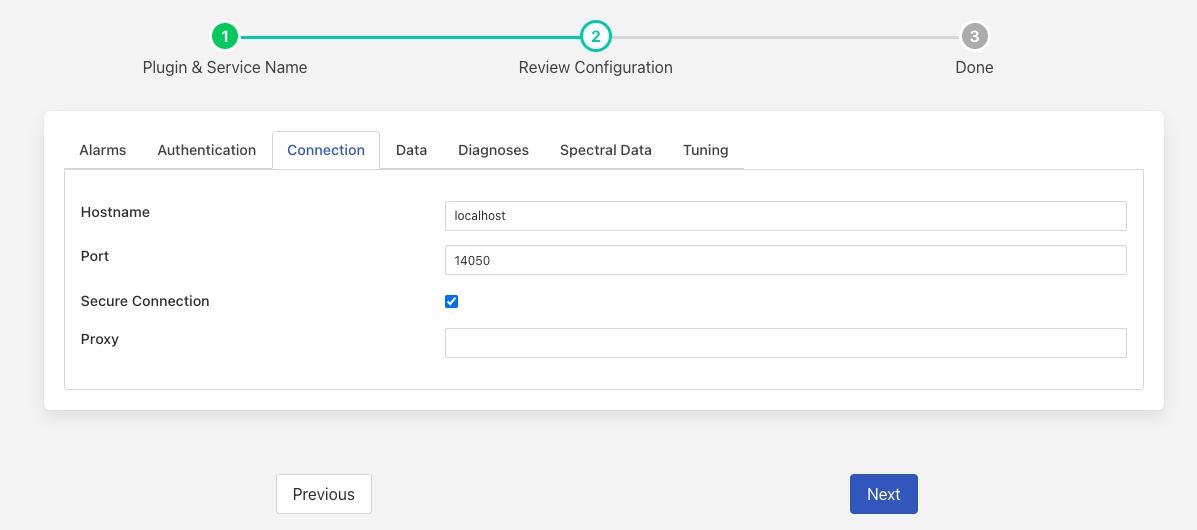
Hostname: The hostname or IP address to use to connect to the Observer Monitor API.
Port: The port to use to connect to the Observer Monitor API.
Secure Connection: Unable the use of a secure, encrypted connection to the Observer Monitor API.
Verify Certificate: Controls if the HTTPS certificate should be verified with a certificate authority. If using a self signed certificate then this option should be disabled.
Proxy: The hostname or IP address of a proxy to use when connecting to the Observer Monitor API.
Authentication
The authentication tab contains all the configuration items that relate to the user authentication with the Observer Monitor.
|
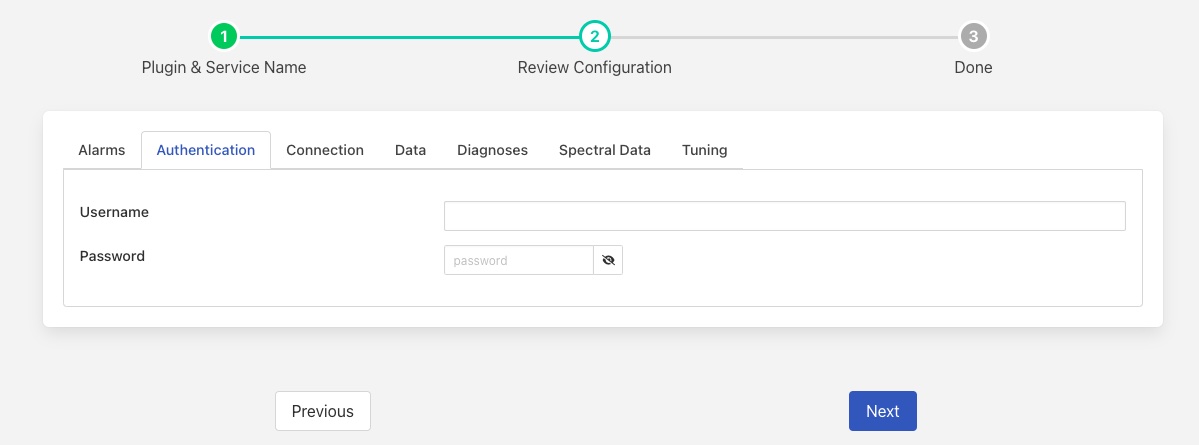
Username: The username to use to authenticate with the Observer Monitor.
Password: The password of the user that is used to authenticate with the Observer Monitor.
The authentication information entered here should match the username and password information setup within the Observer application.
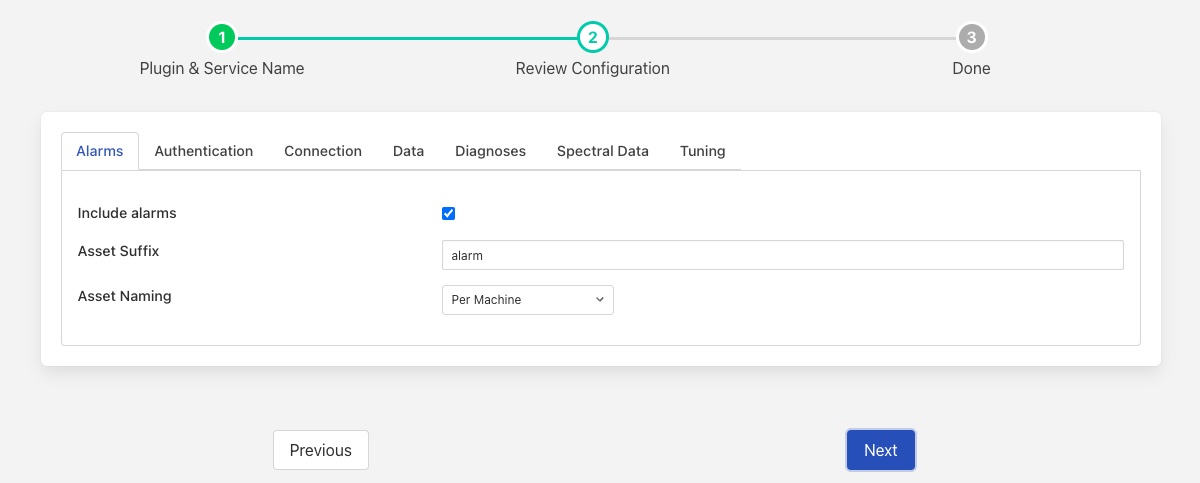
Alarms
|
Include alarms: Alarm data will be retrieved from the Observer Monitor.
Asset Suffix: A suffix or asset name used to name the asset in which alarms are store. See below.
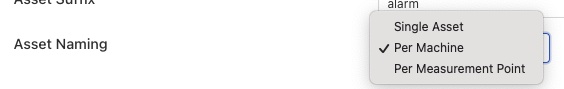
Asset Naming: The plugin can create assets for alarms using three different schemes
Single Asset - if this option is chosen then all of the alarms for all machines share the same asset name. This asset name is the Asset Suffix above with no other text added. Each alarm will contain the machine name and measurement point that triggered the alarm.
Per Machine - an alarm asset is created per machine, with the Asset Suffix added to the machine name to create the asset name. All alarms that related to the given machine are stored with this asset name. The asset name used will be the machine name followed by the Asset Suffix, these will be separated by the separator defined in the Data tab. Each alarm will contain the measurement point that triggered the alarm.
Per Measurement Point - the asset name used to store the alarm data will be the machine name followed by measurement point and asset suffix. Each component will be separated by the separator defined in the Data tab.
Data
The data tab is used to control which data sets are extracted from the Observer API. See also Alarms, Diagnoses and Spectral Data for those specific data sets.
|
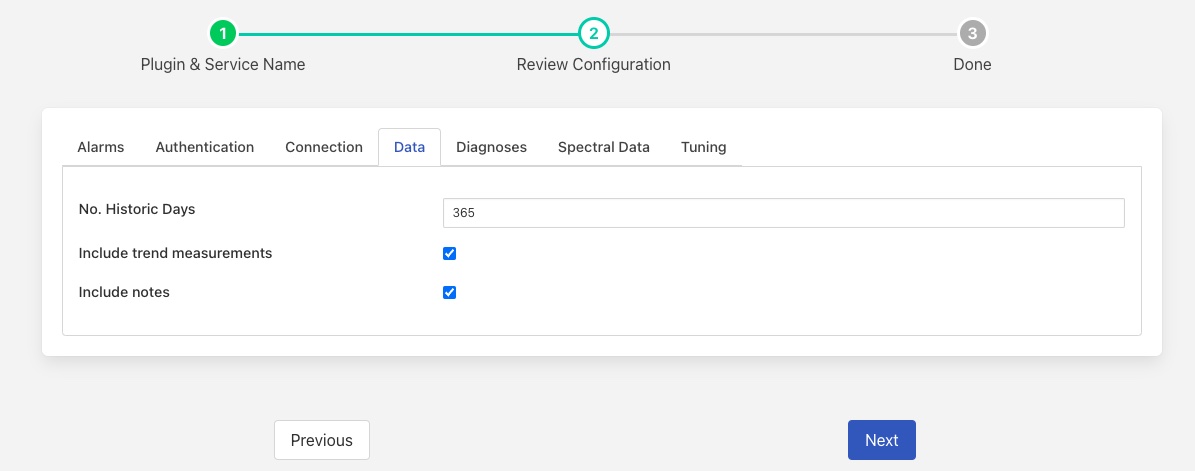
No. Historic Days: The number of days of historic data that should be loaded. Only data that is newer than or equal to the number of days specified will be loaded. Once data has been loaded this configuration parameter will have no affect. See Historical Data
Include trend measurements: The data pulled from Observer will include the trend or overall measurements for each of the measurement points that are managed by Observer.
Include notes: Any notes that have been entered will be retrieved from the Observer system.
Include Machine Meta-Data: Allow the inclusion or exclusion of constant machine meta-data. This is information associated with a machine that can be included in every measurement on that machine. The power, gearing and ISO Class of the machine are included in this data.
Asset Prefix: An optional prefix to be added to the start of every asset name generated by the south plugin. If non-empty the prefix will be added followed by the asset separator, see below.
Asset Separator: Asset names can be composed of several components, this configuration option allows the separator between those components to be defined.
Diagnoses
|
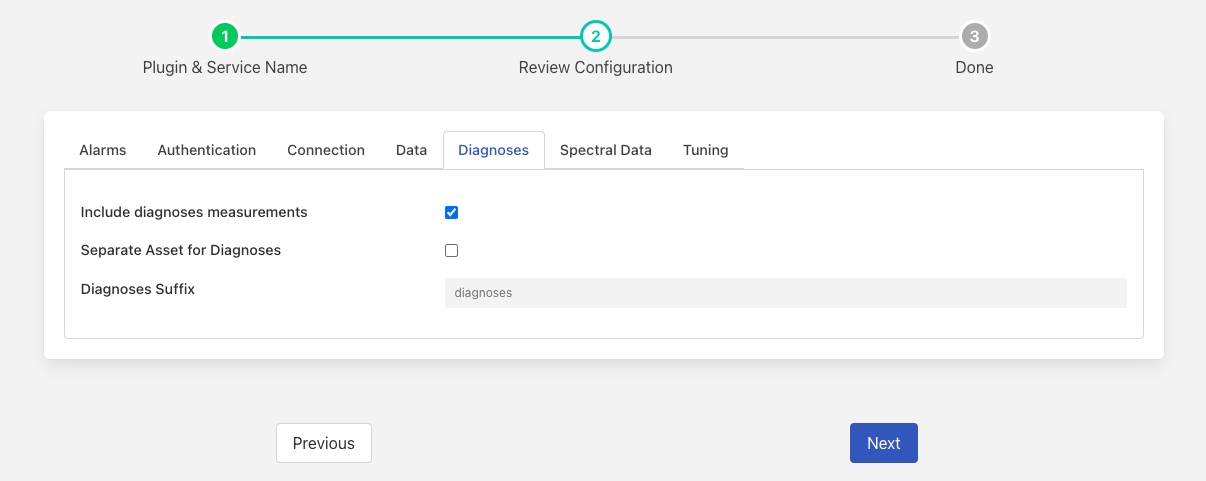
Include diagnoses measurements: The data retrieved from Observer will include the diagnosis results for each of the measurement points that are managed by Observer.
Separate Asset for Diagnoses: The plugin can either add diagnoses data to the individual assets used for trend data or an create a separate asset for the diagnosis data.
Diagnoses Suffix: The suffix to add to the machine name and measurement point when creating the asset name to store separate diagnoses data.
Spectral Data
This tab deals with the spectral or time waveform data that may be retrieved from Observer. The data is retrieved and converted from the array of samples that Observer provides to a time series for each waveform. This allows the data to be stored in standard data historians upstream.
|
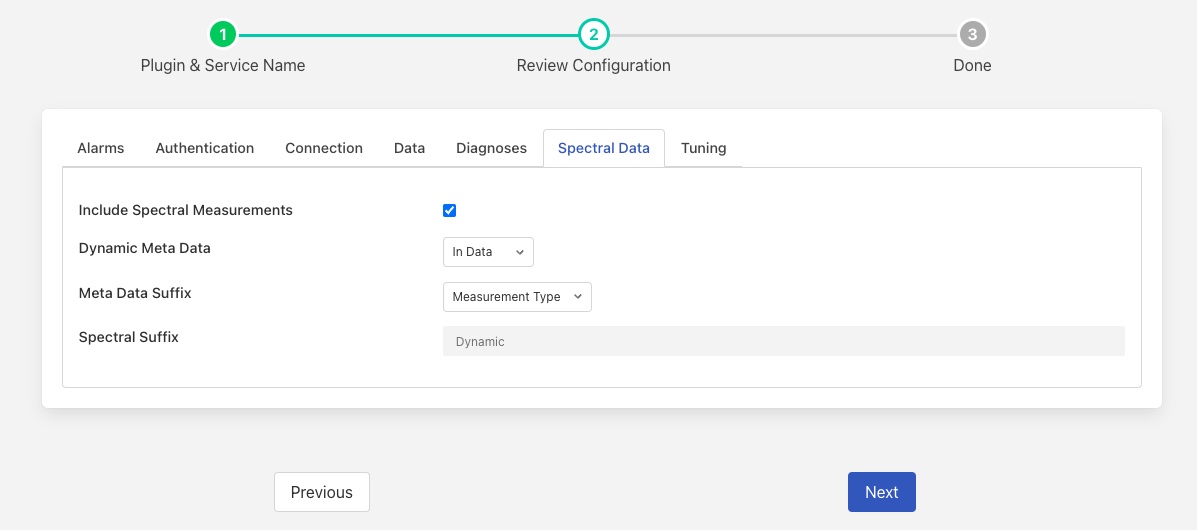
Include spectral measurements: Include the spectral or waveform dynamic data for each measurement point.
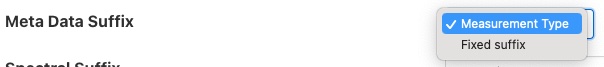
Meta Data Suffix: This controls how the suffix is generated that is added to measurement point when generating the dynamic data.
Measurement Type: The suffix is generated using the message type and the measurement direction.
Fixed suffix: A single fixed suffix is used as defined in the next configuration item.
Spectral Suffix: The fixed suffix to add to the asset name when storing dynamic data.
Filtering
The plugin provides a mechanism to allow a subset of the machines that are monitored by Observer to be processed and/or a subset of the measurement points. This allows for the data ingested and processed to be limited to only those of interest to an upstream system, using the FogLAMP pipelines it is possible to remove data before it is sent upstream, however having the filtering at this low level means that data is not pulled from the Observer system only to be later discarded. This lessens the load on both the Observer system and to FogLAMP instance. The filter tab provides the interface for controlling what machines and measurement points are ingested.
|
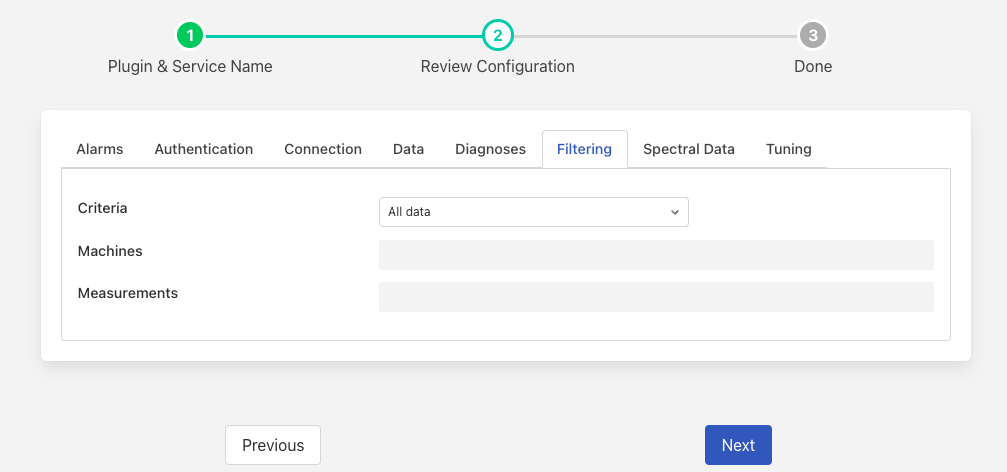
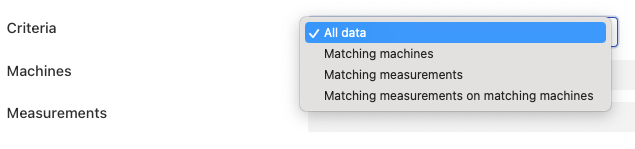
Criteria: The filtering criteria that will be applied. There are four options that may be chosen
All data: No data will be filtered out and FogLAMP will ingest data for all machines and measurement points that Observer provides.
Matching machines: Data is only ingested that relates to the set of machines whose names match those in the list of machines given below.
Matching measurements: Data in ingested for all machines for the measurement points listed in the measurements list below. If a machine does not have any measurement points that match any of the names given then no data will be ingested for the particular machine.
Matching measurements on matching machines: Both the list of machines and measurement points will be considered when filtering the data. This allows a subset of measurement points for a subset of machines to be ingested.
Machines: A comma separated list of machine names for which data will be ingested. The names may be expressed as regular expressions, white space and case are not significant in these names. See below for a more detailed discussion.
Measurements: A comma separated list of the measurement point names for which data will be ingested. As with the machine names above the measurement point names may use a regular expression, case and white space are not significant.
The list of names may include one or more regular expressions in the list. The regular expression syntax used is the standard for regular expressions, see Regular expression The expression must match the entire name. For example to match all machine names that start with the prefix VR and include the work Roll in the name, a regular expression of the form
vr.*roll.*
This would match any name start VR followed by any number of characters and then ROLL followed by any number of characters. Note since case is not considered Vr123 Rollxyz, VR123 ROLLxyz*, etc would also match.
If we wanted to match all machines with the prefix HR as well, then we have a choice, we either make the regular expression more complex
[vh]r.*roll.*
Or we have two regular expressions in the list
vr.*roll.*, hr.*roll
A name need not be a regular expression, if we wanted not just the machines with the VR and HR prefix but also the machine named Finisher 10, then we can create a list of machine names
vr.*roll.*, hr.*roll, Finisher10
The same rules apply for the list of measurement points.
Asset Naming
The Observer plugin has a number of rules it uses to determine the names of the assets within FogLAMP that it creates. The asset names are derived from the names returned by Observer and are formed from multiple components with an optional separator between those components.
Trend measurements returned by Observer will be named with the optional Asset Prefix, the machine name, a sub-machine name if these have been defined in observer and the trend name. All of these components may be separated by the optional Asset Separator. If a multi-channel trend has been defined within Observer then the asset name will also have the name of the channel appended to it, again with an optional separator between the channel name and the rest of the asset name.
Diagnoses data may be stored in a separate asset from the trend data or with the same asset name. If it is stored in a separate asset, that asset will be named in the same way as the trend data asset, but with a configurable suffix append to the asset name, the Diagnoses Suffix.
Alarms are always stored in separate assets, the naming of those assets is configurable and may be a single alarm asset, the machine name or the machine name and measurement point name. In all case the global Asset Prefix will be prepended to the asset name if it is defined.
Spectral data is stored in assets named with the optional Asset Prefix, the machine name, a sub-machine name if these have been defined in observer, the measurement point name and a suffix of the measurement type returned by Observer or a fixed suffix. All of these components may be separated by the optional Asset Separator.
Tuning
This tab contains items that relate to tuning the performance of the plugin, these settings are in addition to the Advanced Configuration that is available for tuning the service that is running the plugin.
|
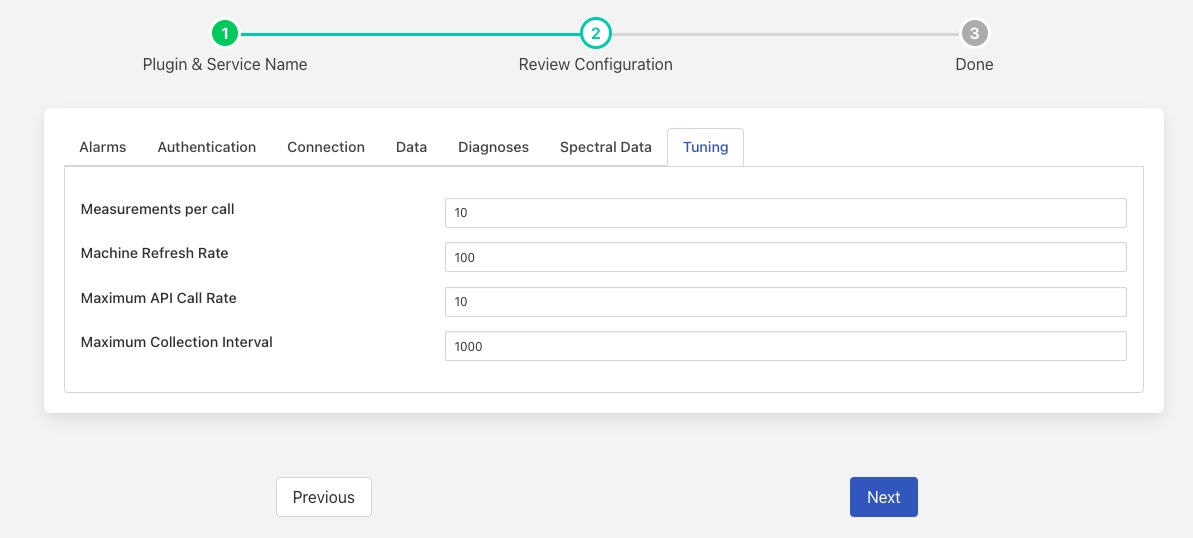
Measurements per call: This item is mainly related to loading historical data and controls how many measurements are retrieved in a single call for a measurement point. A large value will result in more memory being required for the plugin and larger payloads being moved between Observer and FogLAMP, but will reduce the amount of time required to load the initial backlog of historic data.
Machine Refresh Machine: This configuration item controls how the plugin will discover new machines and measurement points. If set to Manual then the plugin will never attempt to discover new machines and measurement points. If set to Automatic then the plugin will will scan observer and automatically pick up new machines and measurement points that have been added to Observer.
In Manual mode the user must restart the plugin, by disabling and re-enabling the service to pick up new measurement points.
Note
A scan to discover new machines and measurement points is always made when the plugin starts regardless of the setting of this configuration option.
Machine Refresh Rate: This item controls how often the plugin scans the Observer hierarchy for new machines and measurement points that can be retrieved. Setting this value to a lower number will reduce the latency for readings from new machines appearing from Observer. Reducing the number will impose extra load on the Observer system. The Machine Refresh Method must be set to Automatic in order for this configuration setting to have any affect.
Note
If filter of machines & measurement points is in use, then only new machines and measurement points that are discovered and which match those filtering rules will be added.
Maximum API Call Rate: This maximum number of calls per second that will be made to the Observer API. This is used to control the load that is placed in the observer system. A low number of calls per second will impact the performance of the collection mechanism, especially when collecting historical data from Observer. Too high a number will impose heavy load on the Observer system.
Maximum Collection Interval: The maximum amount of time, expressed in milliseconds that the plugin will wait before calling the Observer API to collect new data if no data was returned in the previous collection. This allows the load on the Observer API to be tuned in situations where new data is not constantly available. Making this value too high will result in a longer delay before new data is read by the plugin. Making it lower will increase the load on the Observer system.
Historical Data
The plugin can load a configured duration of historical data, this is expressed as a number of days worth of data. This data is loaded before any current data will be read when the service that hosts the plugin is run for the first time. Changing the number of days to load after the plugin has been run will not cause the plugin to load any older data.
The loading of historical data may require the FogLAMP instance to buffer large volumes of data, care should be taken that the disk that stores the buffer is sufficiently large not to run out of space during this process. If a SQLite storage plugin is used this is the data directory of FogLAMP, if PostgreSQL is used then it is the data directory of the PostgreSQL database. In addition, if using SQLite the /tmp directory should also be sufficiently large.
The recommended size of the data directory is to allow for 10Mb per day of data and a /tmp directory with at least 1Gb of free space.
The actual amount of space required will depend upon which data sets are loaded, loading of spectral data will require significantly more storage than trend data for example.