PI Server South Plugin
The AVEVA PI Core suite of products represents software systems deployed at a customer site. Together, these systems collect, store, enhance, organize, and visualize real-time data streams. The heart of the PI Core portfolio is the PI Server which consists of the PI Data Archive and the PI Asset Framework (AF). This South plugin reads PI Server data by exception which means that the plugin is notified of data changes in PI. This guarantees that data changes will not be missed. Because of this, the plugin does not need to poll the PI Server for current data values.
The South service to collect PI Server data is created in the same way as any other south service in FogLAMP.
Use the South option in the left hand menu bar to display a list of your South services
Click on the + add icon at the top right of the page
Select the piserver plugin from the list
Enter a name for your south service
Click on Next to configure the PI Server plugin
The configuration parameters that can be set on this page are:
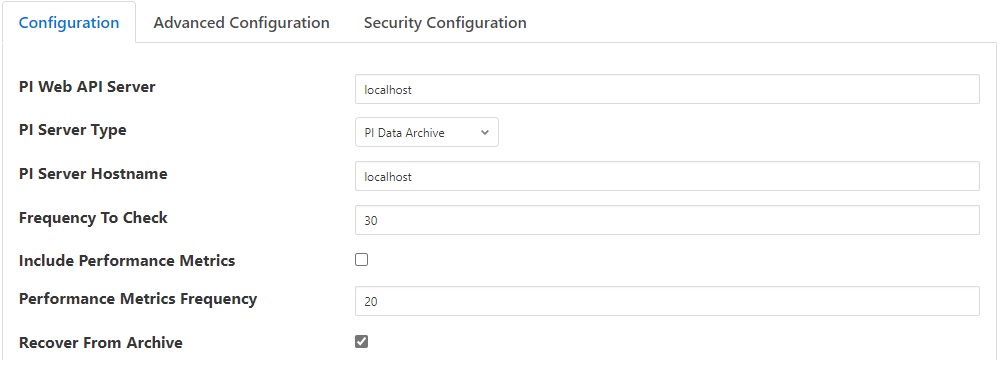
- Basic Information:
PI Web API Server: The hostname or address of the PI Web API server. This is often the same address as the PI Server.
PI Server Type: A drop-down to select the PI Server type. Choices are: PI Data Archive and PI Asset Framework.
PI Server: The hostname of the PI Server. This hostname must be known to the system running the PI Web API Server. To find valid PI Data Archive server names, use a browser to run the PI Web API query https://myhost/piwebapi/dataservers. To find valid PI Asset Framework server names, run the PI Web API query https://myhost/piwebapi/assetservers.
Frequency To Check: Choose how frequently to check the PI Server for data updates, in seconds.
Include Performance Metrics: If true, periodically produce a separate Reading with plugin performance metrics.
Performance Metrics Frequency: Rate at which to generate performance metrics, as multiples of Frequency.
Recover From Archive: If true, recover data values from the PI Server archive while the plugin was down.
|
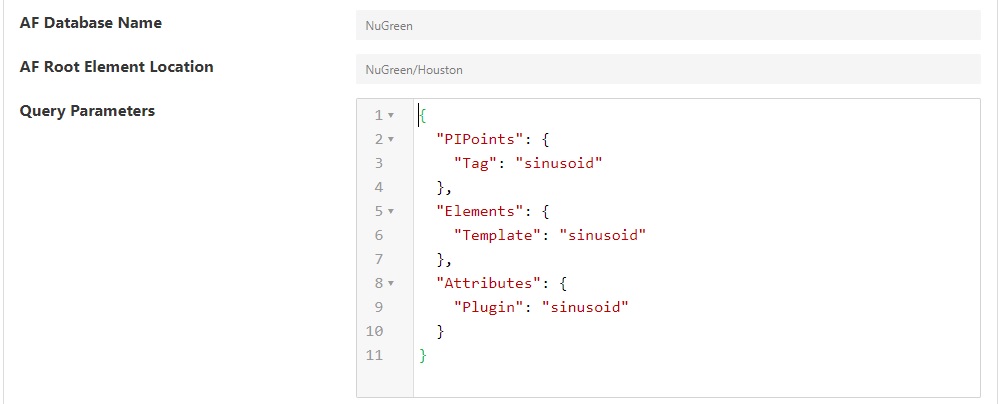
- For Asset Framework configurations:
AF Database Name: Name of an AF Database hosted by the selected PI Asset Framework server.
AF Root Element Location: Top level of the AF hierarchy to search for AF Attributes.
- Query Parameters: A JSON document with parameters for querying the PI Data Archive and PI Asset Framework.
Syntax can be found in the page Search Query Syntax. Query Parameters have three sections:
PIPoints : Used when PI Server Type is PI Data Archive
Elements : Used when PI Server Type is AF Asset Framework
Attributes : Used when PI Server Type is AF Asset Framework
PI Data Archive:
- PIPoints: PI Points can be searched by any PI Point Attribute value. The common choices are:
Tag
Name
Descriptor
PointType
PointSource
ChangeDate
DigitalSet
Engineering Units
To Search by more than one condition you need to provide operator using JoinWith:
Example:
{
    "PIPoints": {
        "Tag": "sinusoid",
        "JoinWith": "AND",
        "PointType": "Int32",
        "JoinWith": "OR",
        "EngUnits":"STATE"
    }
}
If JoinWith key/value pair is not used then the AND operator will be used by default between two key/value pairs. By default, the key/value pair uses the equal operator to find PIPoints. To find PIPoints by inequality, add the inequality operator (“<>”) to the key/value pair. For example, “Tag”:”<>sinusoid”. Note that no space is allowed between the operator “<>” and the value.
PI Asset Framework:
- Attributes: Attributes can be searched by any Attribute value. The common choices are:
Name
Template
AF Attributes mapped to PI Points (“PlugIn”:”PI Point”)
- Supported filters to be used inside Elements Tag
Name of root Element
Template name
Category
CreationDate
Example:
{
    "Elements": {
      "Name": "Houston",
      "JoinWith": "AND",
      "Category": "Locations"
    }
}
Key/Value inside Elements tag supports only equality
- Supported filters to be used inside Attributes Tag
Name
Plugin
Type
Example:
{
    "Attributes": {
        "Name": "Temperature",
        "JoinWith": "AND",
        "PlugIn": "PI Points"
    }
}
|
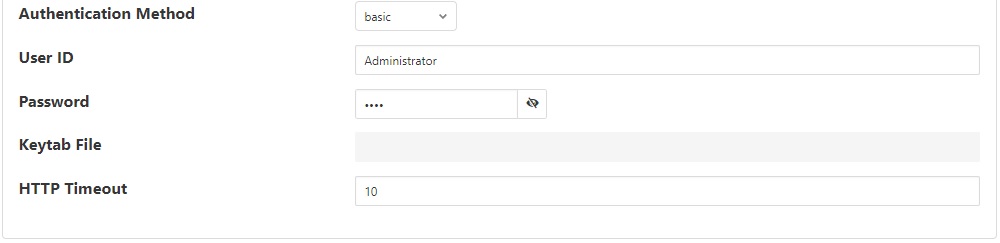
- PI Web API authentication
PI Web API Authentication Method: A drop-down with the authentication method to be used: Anonymous, Basic or Kerberos. Anonymous equates to no authentication. Basic authentication requires a username and password. Kerberos allows integration with your single sign-on environment.
PI Web API User ID: For Basic authentication, the username to authenticate with the PI Web API.
PI Web API Password: For Basic authentication, the user’s password.
PI Web API Kerberos keytab file: The Kerberos keytab file used to authenticate.
- Connection management (These should only be changed with guidance from Technical Support):
HTTP Timeout: Number of seconds to wait before Fledge will time out an HTTP request.
Principles of Operation
The PI Server South plugin uses the Stream Updates feature of the PI Web API to retrieve data updates from the PI Server. For PI Data Archive points and AF Attributes mapped to the PI Point Data Reference, this means data values are queued by the PI Data Archive’s Update Manager. The data values remain in the Update Manager’s queue until the PI Server South plugin requests them. The Frequency To Check configuration parameter determines how often the PI Server South plugin will check the queue for data updates.
Monitoring the Update Manager Queue
The status of the PI Data Archive Update Manager queue can be monitored using the PI System Manager Tools (PI SMT) application which can be obtained from AVEVA. In the Servers section in the upper left corner, connect to the system running the PI Data Archive. In the left-side menu pane, open Operation and then Update Manager. In the Server drop-down at the top of the screen, choose the PI Data Archive system; this selection is not made by default.
|
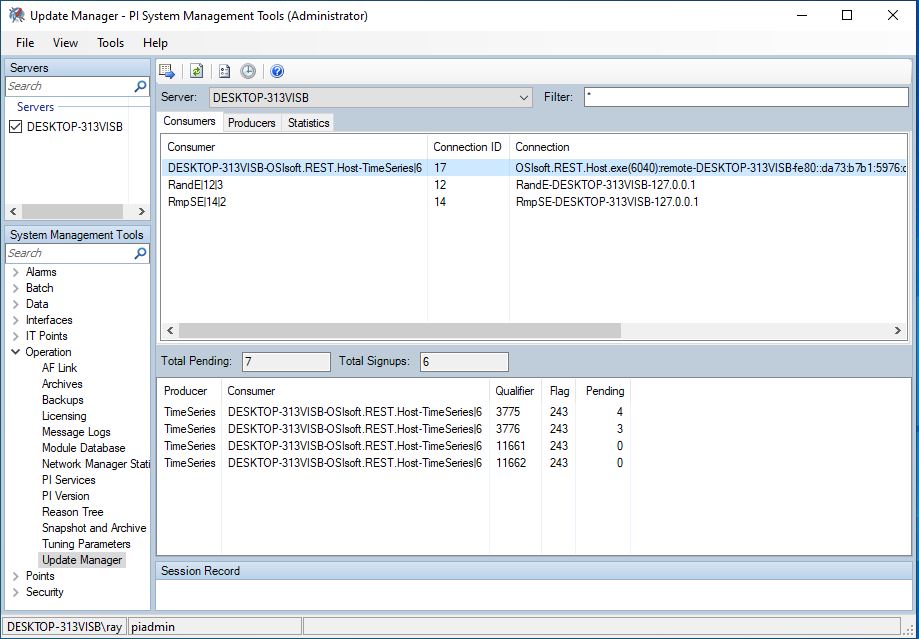
In the Consumer list in the upper pane, you will see the PI Web API server name followed by OSIsoft.REST.Host-TimeSeries and a number. This represents the request for data updates registered by the PI Web API. In the lower pane, you will see entries for the individual TimeSeries items. The number to watch is the Total Pending in the lower pane. This normally climbs and then resets to a low number when the PI Server South plugin has retrieved data updates.
Lower Frequency To Check numbers mean the Update Manager queue will be checked more often resulting in a more timely delivery of data updates into FogLAMP. The Frequency To Check value should be adjusted so that the maximum Total Pending number remains below 10,000. If the Total Pending number climbs above 50,000, the Update Manager queue will overflow. If this happens, the PI Web API’s Consumer will be closed by the PI Data Archive and no further data values will be queued.
Note
Due to a known problem in the PI Web API, a REST client will not be notified if the data update queue overflows. The PI Server South plugin will continue to request data updates but no error will be reported and no data will be returned. The workaround is to restart the PI Server South plugin instance.
Performance Metrics
If the Include Performance Metrics configuration setting is checked, the PI Server South plugin will periodically generate a Reading with metrics to show the performance of data update retrieval from the PI Web API. The Performance Metrics Frequency configuration setting determines the time period. The setting is multiples of Frequency To Check. For example, if the value is 4 then every 4th retrieval of data updates will be accompanied by a performance metrics Reading. If the Frequency To Check is 30 seconds, then performance metrics will be generated every 2 minutes (30 seconds times 4).
Performance metrics appear in a Reading that is sent to FogLAMP. The asset name of the Reading is Metrics. followed by the name of your service. The Reading has 3 Datapoints:
Datapoint Name |
Description |
|---|---|
NumCalls |
Number of PI Web API calls issued to retrieve data updates |
NumValues |
The total number of data values retrieved using the PI Web API |
TotalTime |
Total elapsed time of all PI Web API calls, in seconds |
The Datapoints represent accumulated values since the last performance metrics Reading.